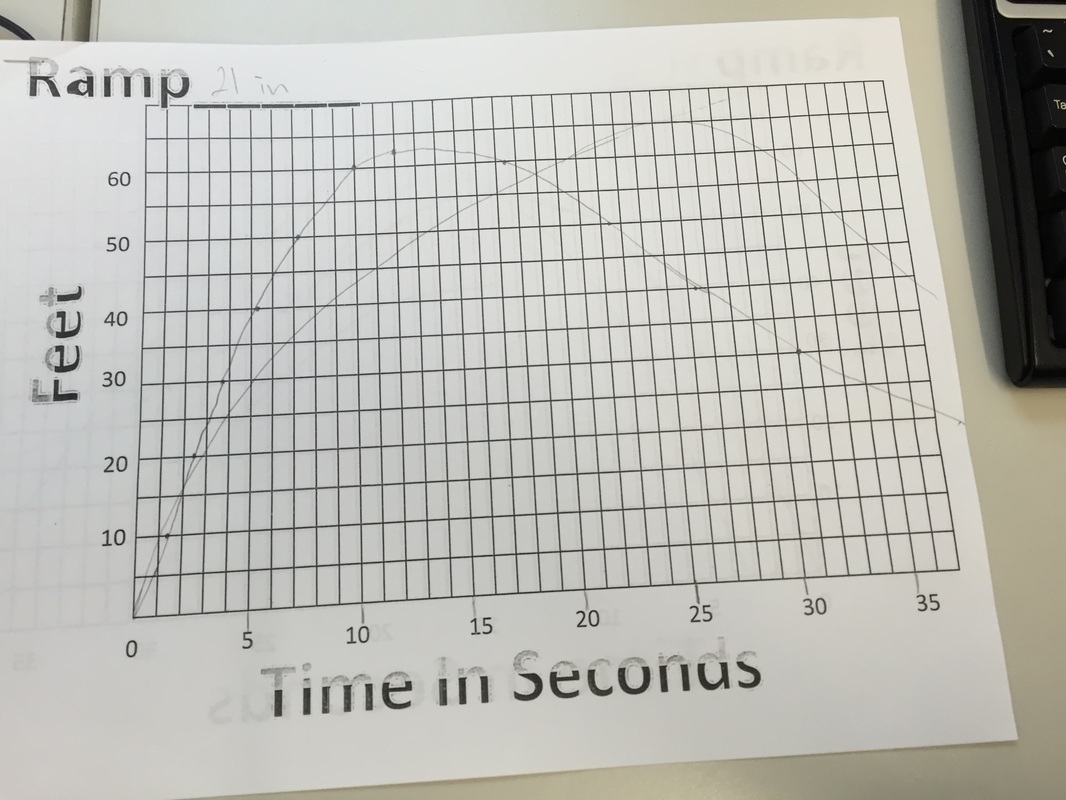
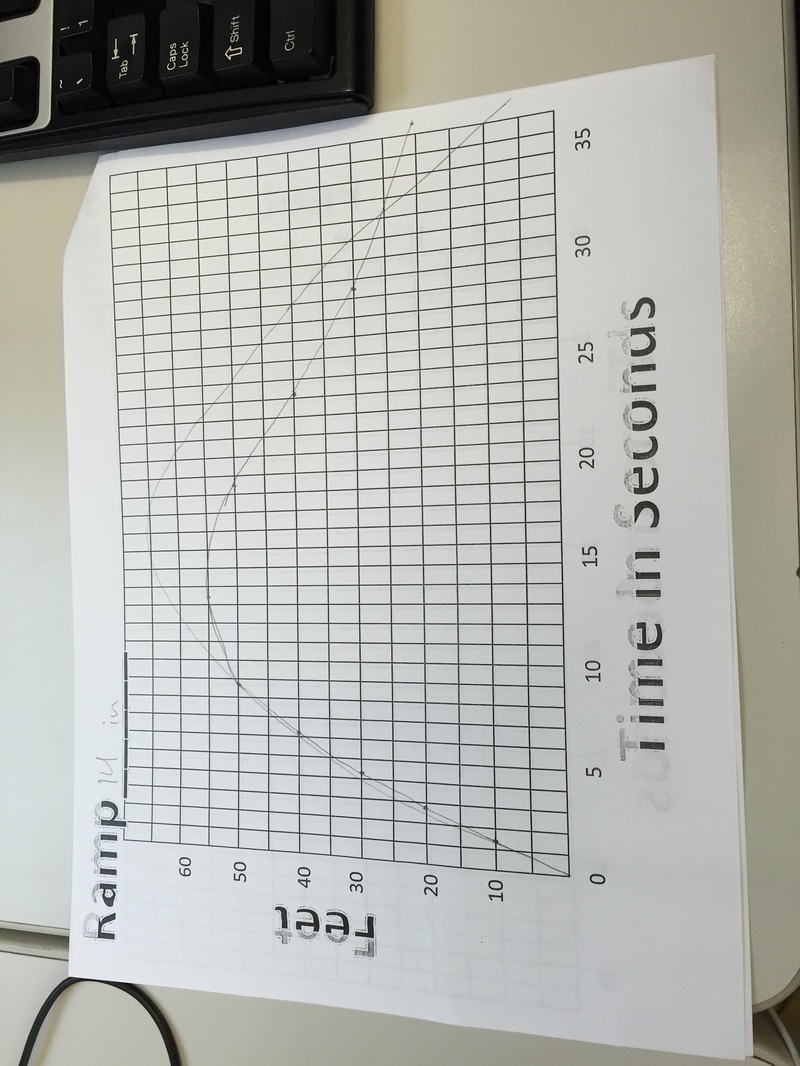
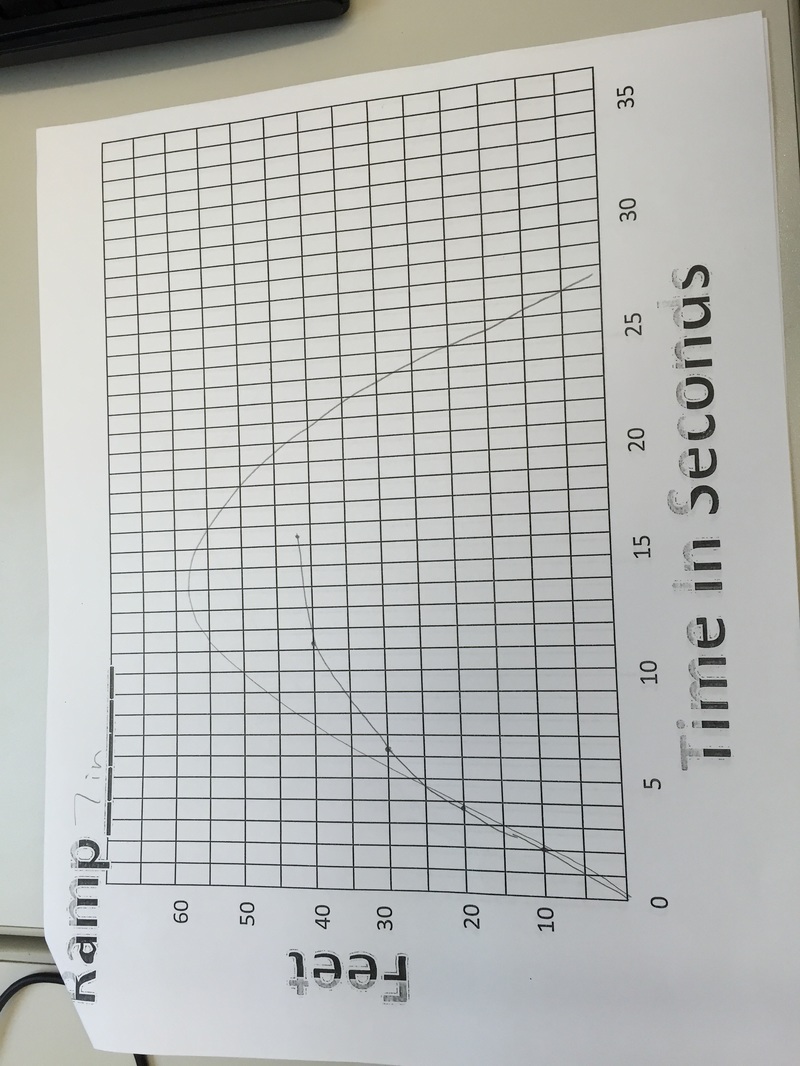
All 3 of my predictions were very close to the actual graphs. My graphs were different because I thought it was gonna take longer for the skateboard to travel farther. The zeros on my graph represent when the skateboard hasn't moved yet and is still on the ramp. The zeros for all 3 graphs are the same. The maximum was highest on the 21 in ramp and the lowest on the 7 in ramp. The graphs rise the fastest when they first go off of the ramp.
 |  |  |
 RSS Feed
