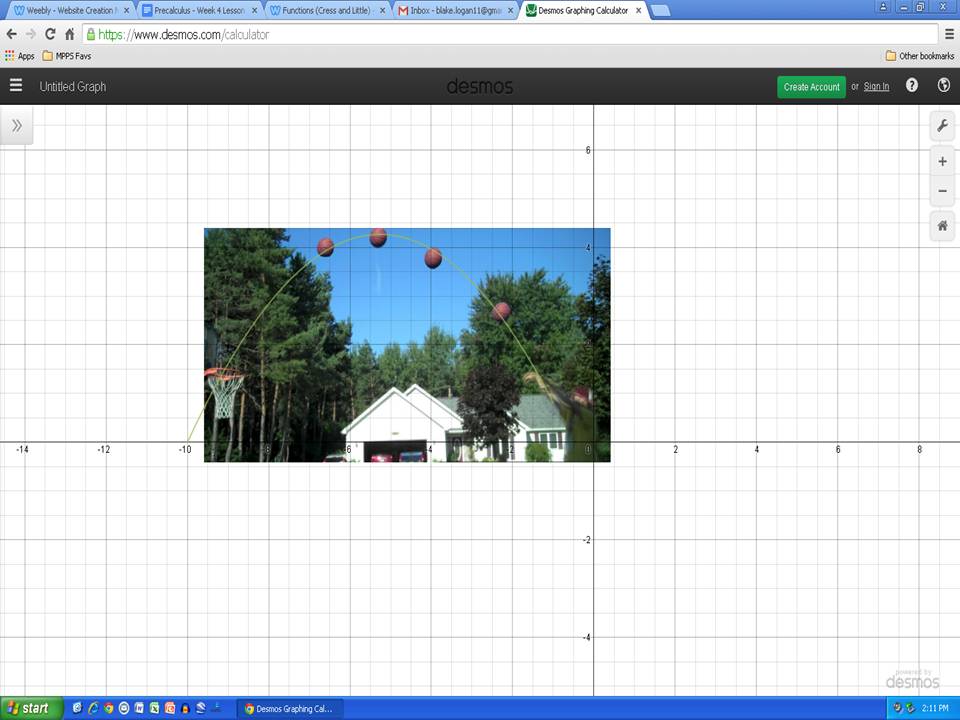
Mr. Creswell makes the basketball because I used a quadratic equation and lined it up and it shows that he makes the basket.
|
Mr. Creswell makes the basketball because I used a quadratic equation and lined it up and it shows that he makes the basket.
0 Comments
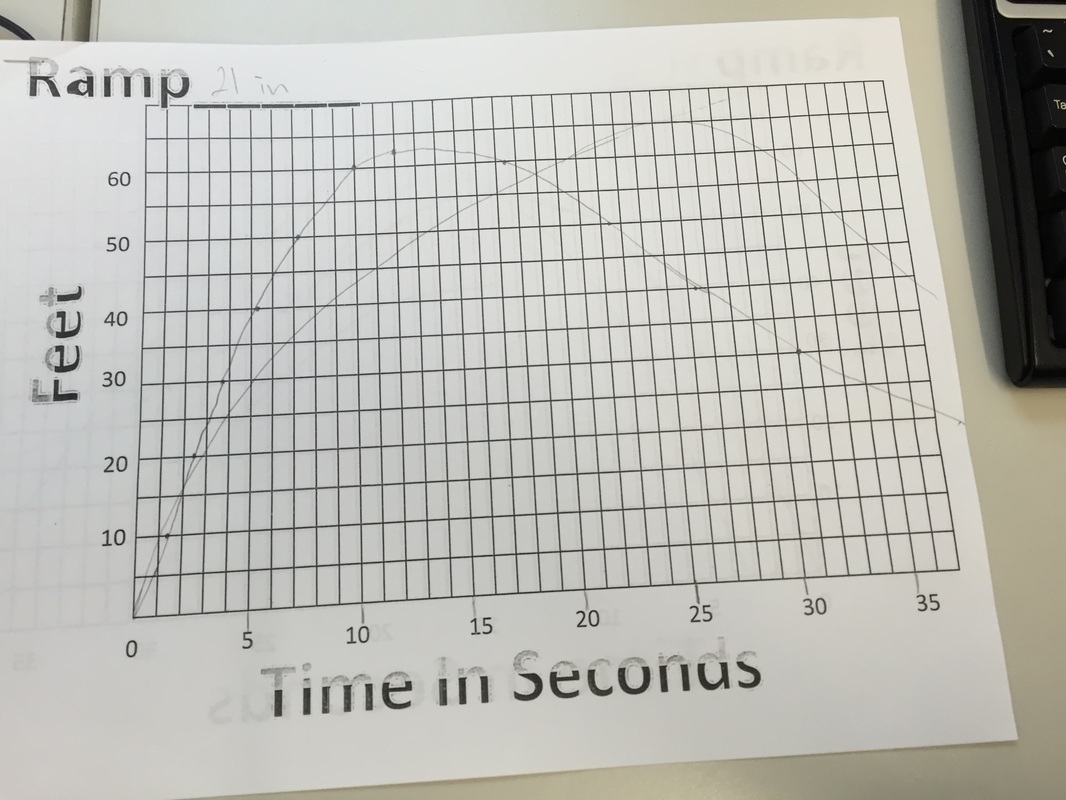
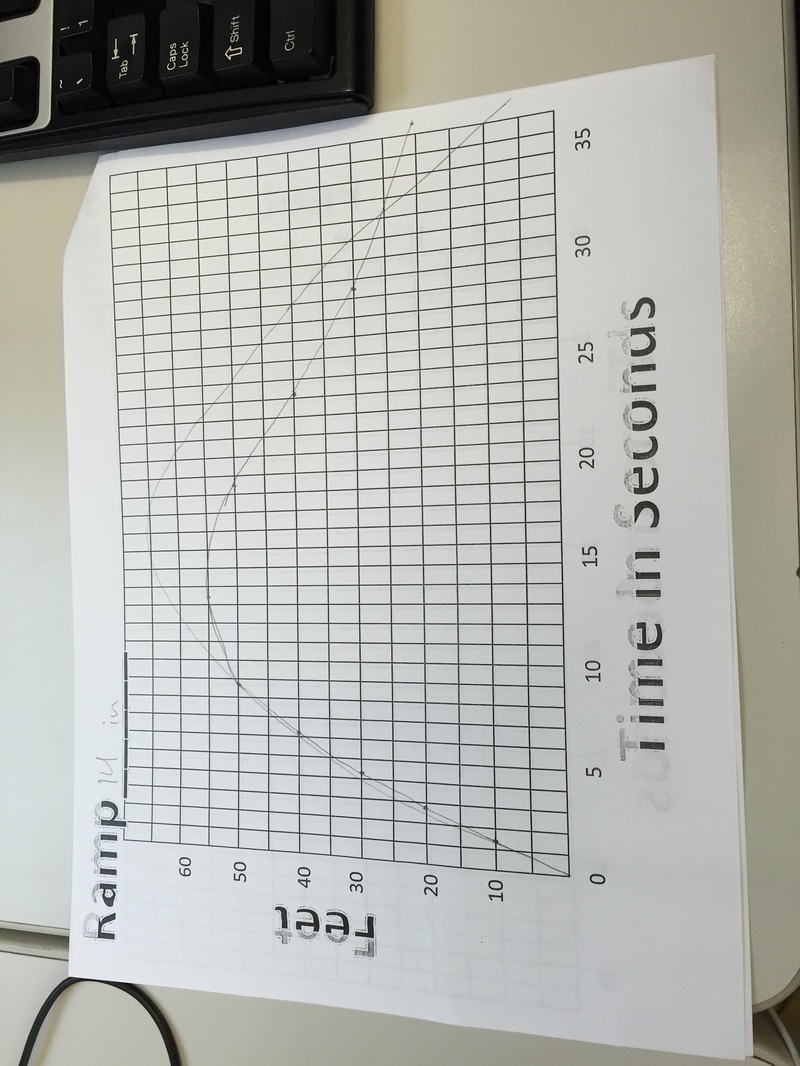
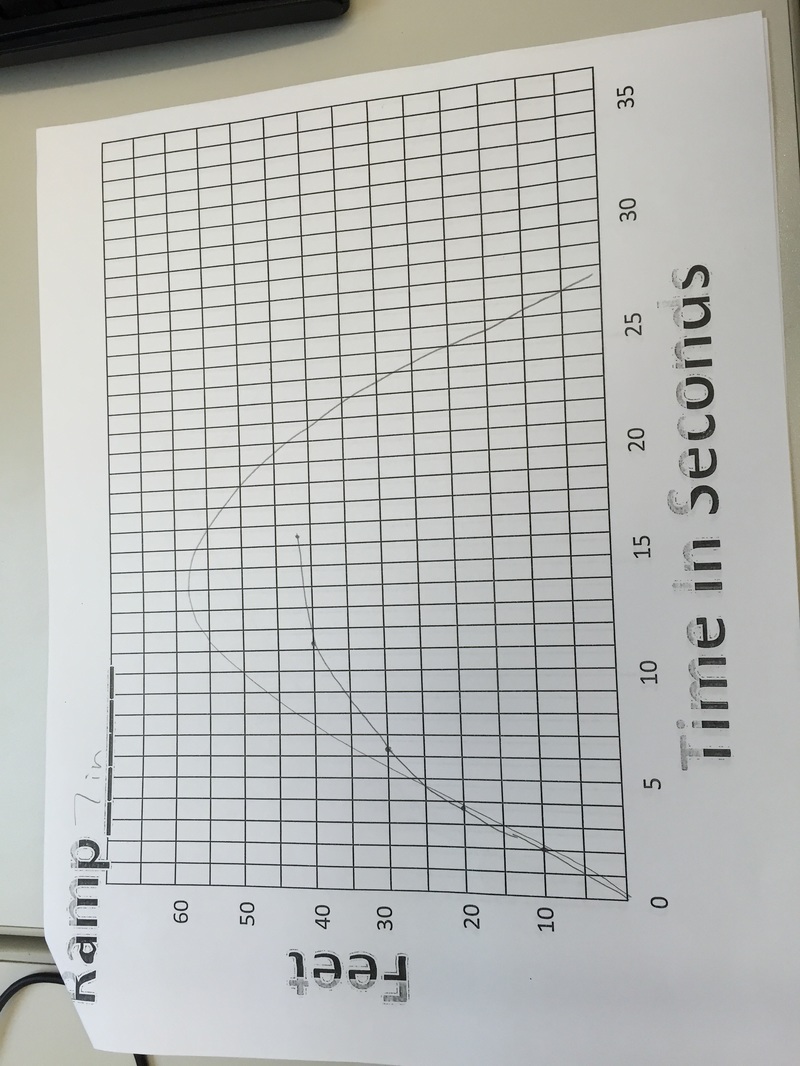
All 3 of my predictions were very close to the actual graphs. My graphs were different because I thought it was gonna take longer for the skateboard to travel farther. The zeros on my graph represent when the skateboard hasn't moved yet and is still on the ramp. The zeros for all 3 graphs are the same. The maximum was highest on the 21 in ramp and the lowest on the 7 in ramp. The graphs rise the fastest when they first go off of the ramp.
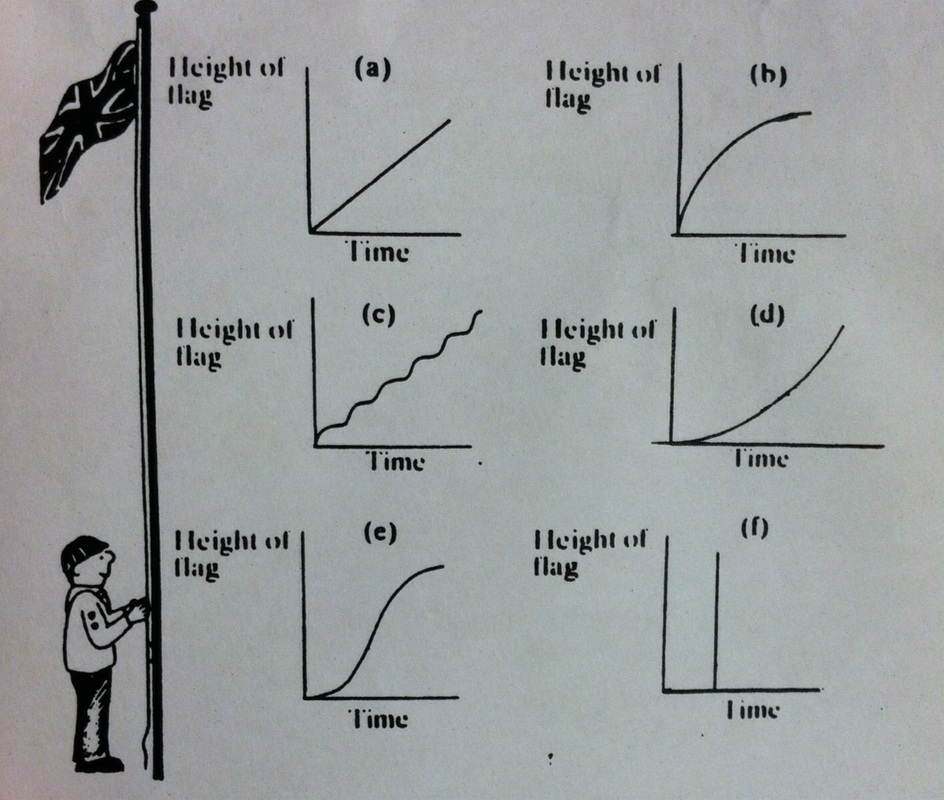 Flag a represents the flag going up at a constant rate as the time goes up. Flag b represents that the flag goes up faster than the time goes up but then the time starts going faster. Flag c represents that he raises it and stops raises it and stops and keeps repeating this method. Flag d represents the time goes up faster than he raises the flag. Flag e represents that he raises the flag slower at first but then raise it really fast. Flag f represents that he raises the flag without the time even moving. Graph A is the most realistic because he raises the flag at a constant rate until it reaches the top. The least realistic flag would be F because he would not be able to raise the flag that fast.
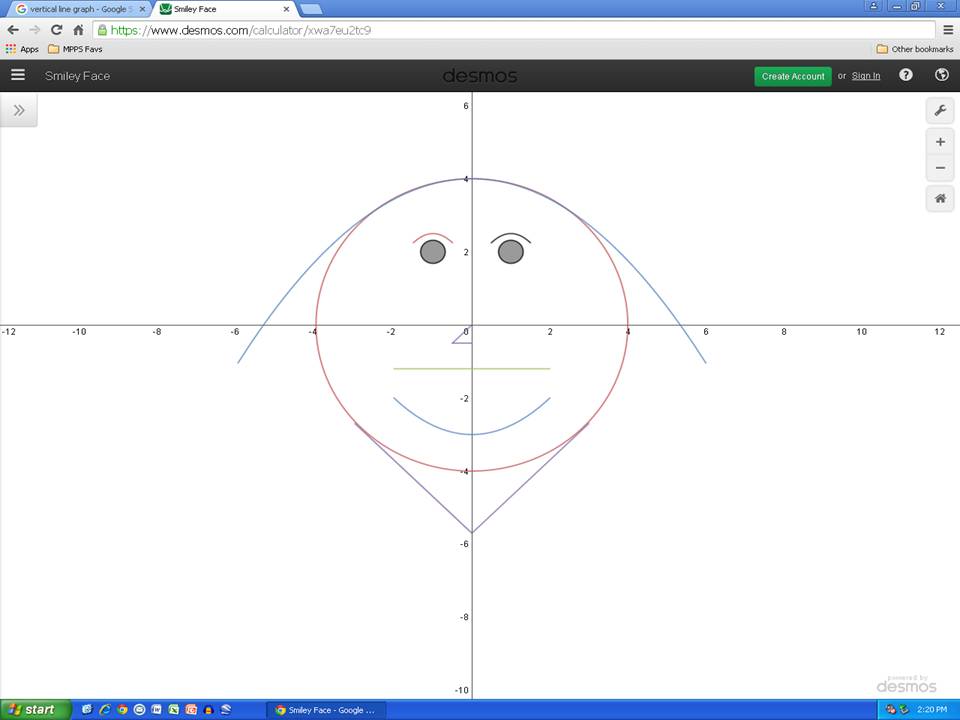
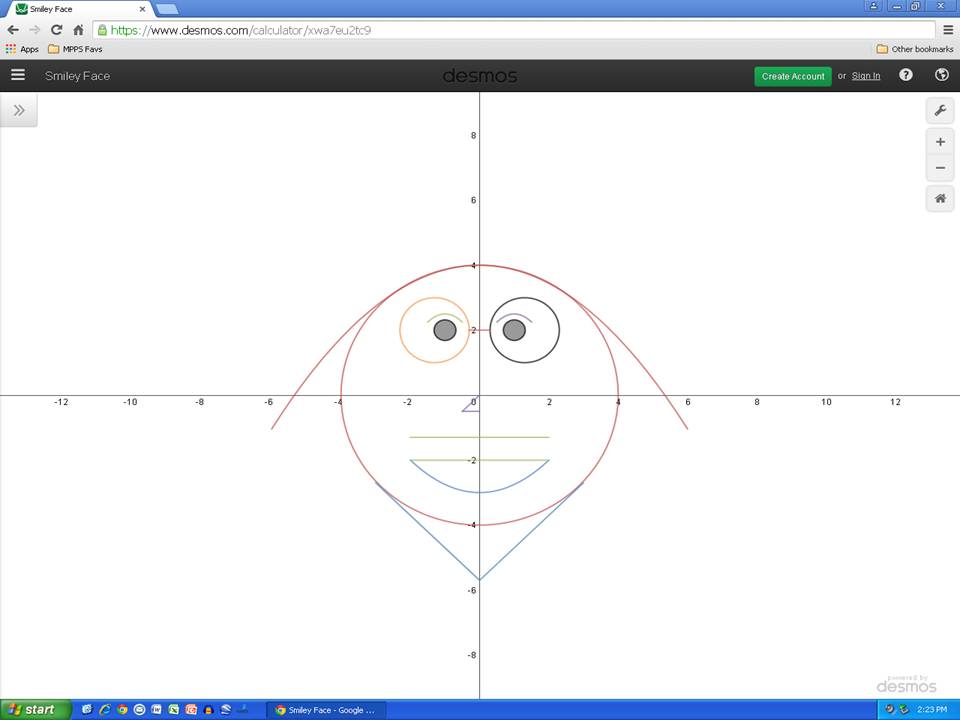
The used many different functions made my smiley face. The functions I used was horizontal, quadratic, and absolute value. I used the horizontal for a mustache, glasses frame, and top of the mouth. I used a quadratic function for the eyebrows and the hair. The absolute value function was used for a beard. I found that trying to move the functions left and right was challenging. I learned how to move them side to side and all of the functions and how to do them.
|
AuthorWrite something about yourself. No need to be fancy, just an overview. Archives
February 2016
Categories |
 RSS Feed
