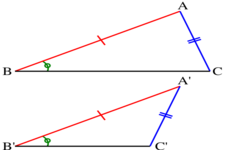
SSA is considered ambiguous because you can get 2 solutions, one solution, or even no solution. We can't just apply it because we don't know if the side will reach the bottom of the triangle. If I was to explain how to do this I would have the person put 2 lines that connect to make an angle. From there label the side right next to the angle. Then find what the measure is from the top line to the base is to find out if you can even make a triangle.
A radian is a unit of angle, equal to an angle at the center of a circle, whose arc length is equal to the radius. The Radian is the angle created by the radius. The unit circle is used to fine cosines and sines in right triangles. You can go around the unit circle and find the radian measures. The radius or diameter of a circle is used to create the angle of a triangle. Radians and Degrees relate because they are both measures in a right triangle. They can both be converted back and forth to each other. I prefer degrees because it is a whole number and easier to work with. However, radians or more mathematically "pure" because it is what we use in formulas.
It would take 42 folds in a paper to reach the moon. This is unrealistic because the paper would be too hard to fold 42 times. The stack of paper would be very small, microscopic after 42 folds.
This is an exponential function. The domain of this graph is [0,infinite) and the range is [0,infinite) also. The domain is all of the x values of a graph and the range is all of the y values.
From this activity I learned how to find if a function is odd or even. They are similar because you have to find the opposite of it and and see if it's the same. To find if it's even you have to see if f(x) and f(-x) are the same and if they are then they are even. To see if they're odd you have to find f(-x) and -f(x) and if they are the same then they are odd. If the function is even then when you graph it it will be the same on both sides of the y-axis. If it odd then the graph will be symmetric about the origin.
Mr. Creswell makes the basketball because I used a quadratic equation and lined it up and it shows that he makes the basket.
All 3 of my predictions were very close to the actual graphs. My graphs were different because I thought it was gonna take longer for the skateboard to travel farther. The zeros on my graph represent when the skateboard hasn't moved yet and is still on the ramp. The zeros for all 3 graphs are the same. The maximum was highest on the 21 in ramp and the lowest on the 7 in ramp. The graphs rise the fastest when they first go off of the ramp.
Flag a represents the flag going up at a constant rate as the time goes up. Flag b represents that the flag goes up faster than the time goes up but then the time starts going faster. Flag c represents that he raises it and stops raises it and stops and keeps repeating this method. Flag d represents the time goes up faster than he raises the flag. Flag e represents that he raises the flag slower at first but then raise it really fast. Flag f represents that he raises the flag without the time even moving. Graph A is the most realistic because he raises the flag at a constant rate until it reaches the top. The least realistic flag would be F because he would not be able to raise the flag that fast.
The used many different functions made my smiley face. The functions I used was horizontal, quadratic, and absolute value. I used the horizontal for a mustache, glasses frame, and top of the mouth. I used a quadratic function for the eyebrows and the hair. The absolute value function was used for a beard. I found that trying to move the functions left and right was challenging. I learned how to move them side to side and all of the functions and how to do them.
|
AuthorWrite something about yourself. No need to be fancy, just an overview. Archives
February 2016
Categories |